Question1
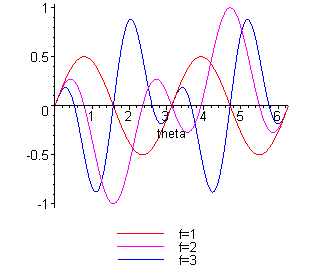
The equation for the graph below is y:=A*cos(f*theta)*sin (theta),A represented amplitued,A=1,f represented frequency,in this case f is changes, theta=0..2*Pi
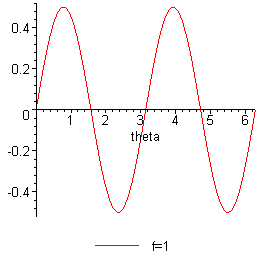
GRAPH 1
"f=1"

GRAPH 2
"f=2"
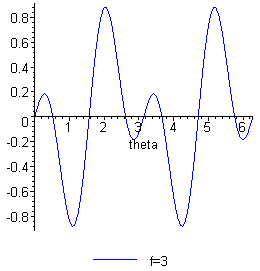
Below is the animation of the combination of above graphs with the values of A=2,f=1 until 3 and the value of theta remain constant
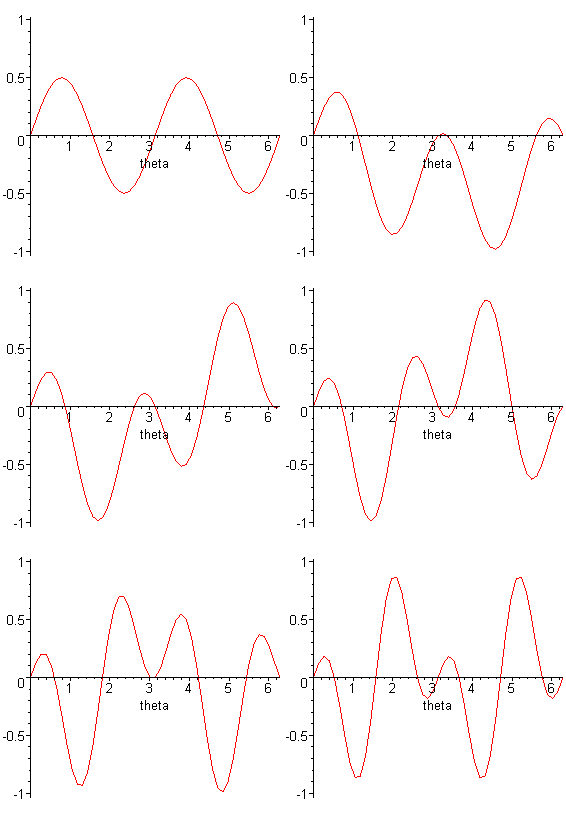
GRAPH 5
Question2
GRAPH6 represented by equation y:=sin(x^3),with the value of x=-Pi..Pi
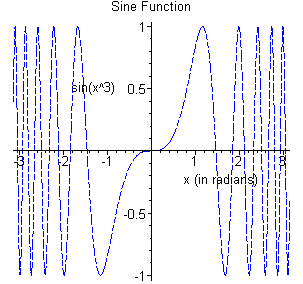
GRAPH 6
IMAGE 1 is the 2D dimension's image.
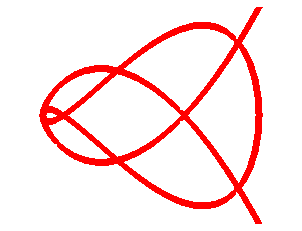
IMAGE1
IMAGE 2 is the 2D dimension's image.
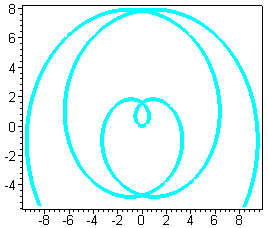
IMAGE 2
IMAGE 1 is the 3D dimension's image.

IMAGE1
IMAGE 1 is the 3D dimension's image.

IMAGE2
Below is the VRML picture converted from the 3D plotting above


